Determine Visibility Along a Route
来源: https://vis-webcontent.s3.amazonaws.com/quickguides/Terrain+Analysis/Viewshed+Route/index.html#/
Lesson content
Lesson 1 of 1
Determine Visibility Along a Route
Route analysis involves many different factors. Viewshed analysis is one such component that can help determine visibility along a route.
In this quick guide, you will use the Viewshed Tool to:
- •
Open and display a Digital Surface Model (DSM) and orthophoto that are co-registered with each other. * •
Determine what areas are visible from a vehicle as it moves along a user-defined route. You will step through closely spaced observer points to see the viewshed results. * •
Animate the viewshed results.
Sample Data
Download sample data below. Then extract the contents of the .zip file to a local directory.
[OpenDC_DSM_Ortho.zip
393.6 MB
DownloadArrow down with horizontal line beneath it](assets/OpenDC_DSM_Ortho.zip)
Open and Display Images
- 1
Select File > Open from the Menu bar. An Open dialog appears. 2. 2
Go to the directory where you saved the sample data. Select OpenDC_DSM.datand *click* Open. 3. 3
Click the Zoom to Full Extent button in the Toolbar.

The DSM covers a small area in Washington, D.C. The source files are available from the OpenDC Data Catalog(opens in a new tab). Pixel values represent height (in meters) above sea level.

- 4
Select File > Open again and select the file OpenDC_Orthophoto.dat. A true-color orthophoto overlays the DSM. It covers the same geographic extent as the DSM.

The orthophoto has a much finer spatial resolution (3 inches, or 7.62 centimeters) than the DSM (1 meter).
Start Viewshed Analysis
- 1
In the Toolbar, click the Viewshed Analysis button.

ENVI adds a “Viewshed Seen Area” ROI layer to the Layer Manager. This layer will show the areas that can be seen from the observer points. The ROI layer is not attached to any rasters in the Layer Manager. This allows you to move it up and down in the layer stack and independently adjust its level of transparency.
An Options tab opens in the bottom-right corner of the application.

The elevation and height values associated with the viewshed are extracted from the DSM, not the visible image. The default range of the viewshed is 250 meters, and the horizontal field of view is 360°.
- 2
In the Viewshed Toolsproperties, change the following:
Horizontal Field of View: 360 degrees
Vertex Interval: 5 meters
Leave the other settings at their default values.
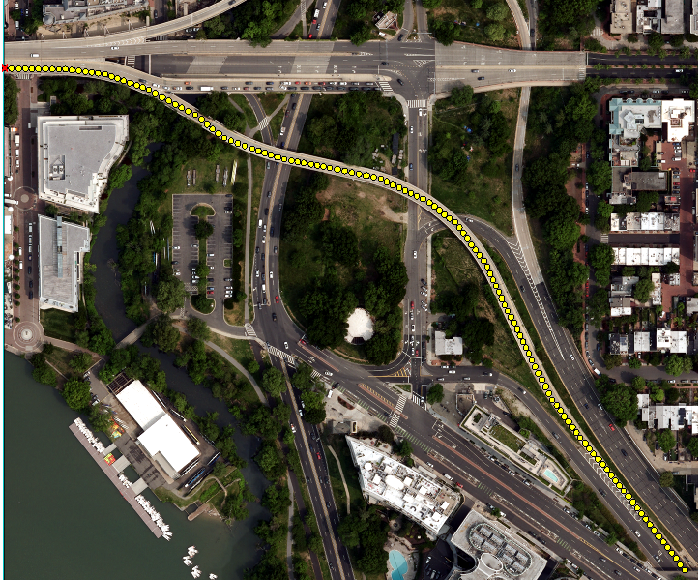
- 3
Right-click in the Image window and select New > Polyline Path. 2. 4
Click on a starting point for the route, then click to draw segments of a polyline along the entire route. At the end, right-click and select Complete and Accept Polyline. Yellow vertices mark all the observer points along the route, spaced 5 meters apart. See the example below.
- 5
Click on any observer point to determine what is visible from it. A red circle marks the selected vertex.

- 6
Click on the observer point, then press the left or right Arrow key on your keyboard. This moves you to the next observer point in the path. You can see how visibility changes from point to point. Or, press and hold an Arrow key to continuously step through observer points, one at a time.
Are there any points along your route where nothing is visible? Obstacles such as trees may be blocking the view in all directions at those points.
- 7
To show what areas are hidden along the route, set the Show Layers property to Both. Optionally increase the transparency of the “Viewshed Hidden Area” layer. The radius of the viewshed is determined by the Range (m) property. In the following example, the Range (m)value is 100 m.

Animate the Viewshed
Instead of using the Arrow keys to move from point to point, you can animate the viewshed along the route.
- 1
Locate the player buttons at the bottom of the Options tab:

- 2
Click the Play Forwards button to start the animation. It steps through the vertices to show the viewshed from each point. If you were to draw multiple paths on the image, the animation would step all the way through the first path that was drawn, then step through each successive path, in order of creation. 2. 3
Click the Pause button. Animation stops. 3. 4
Click the Play Back and Forth button. The animation plays forward to the end of the path, then reverses to animate backwards. 4. 5
Optional: Save the animation to a video file by clicking the Save to MPEG button and specifying an output file name. 5. 6
This concludes the exercise.
Viewshed assessment of a planned route can identify potential choke points that otherwise would not be known. What may seem like the shortest, most ideal, route on a map could be a poor choice due to multiple blind spots. You might discover that a longer route with better visibility is preferred.
See the following quick guides for additional viewshed capabilities:
- •
Viewshed Analysis: Determine Visibility from a Single Observer Point * •
Viewshed Analysis: Determine Visibility from an Area
Your input is important to us, please take a few moments to fill out ourQuick Guide Feedback(opens in a new tab)form.
© 2024 NV5 Geospatial Solutions, Inc. This information is not subject to the controls of the International Traffic in Arms Regulations (ITAR) or the Export Administration Regulations (EAR).