Draw and Edit Vectors
来源: https://vis-webcontent.s3.amazonaws.com/quickguides/Vector+Data/Draw+Edit+Vectors/index.html
Lesson 1 of 1
Draw and Edit Vectors
In this quick guide, you will:
- •
Display a Landsat image as a base image for drawing and displaying vectors. * •
Create a new vector layer, draw polygons along roads, and save the vector layer to a shapefile. * •
Add, edit, and delete vectors. * •
Change vector properties. * •
Change vectors to feature counts.
Vectors are points, multipoints, polylines, or polygons used to mark areas of interest within an image. Use the Vector Toolbar buttons to work with vectors. ENVI supports shapefiles (.shp, excluding Z and M polygons), GeoJSON (.json, .geojson read-only support), and ENVI vector files (.evf) and OGC GeoPackage vector file (.gpkg).
Sample Data
Download sample data for this quick guide below. Then extract the contents of the .zip file to a local directory.
[Landsat_LasVegas.zip
103.7 MB
DownloadArrow down with horizontal line beneath it](assets/Landsat_LasVegas.zip)
Open a Landsat Image
For this exercise, you will use a georeferenced Landsat image as a base layer for displaying vectors.
- 1
Select File > Open from the Menu bar. An Open dialog appears. 2. 2
Go to the location where you saved the sample data, and select the file LasVegasMay2020.dat. Click Open. The image is added to the Layer Manager and displayed in the Image window.
Create and Save Vector Layers as Shapefiles
- 1
Create a new layer by selecting File > New > Vector Layer from the Menu bar. 2. 2
For Layer Name enter Roads. 3. 3
For Record Type select Polyline from the drop-down menu.

ENVI performs Real-Time Ortho for vector layers created on top of an RPC image. The vector layers will contain projected coordinates that can display with other projected imagery, and projected vector layers will display on top of an existing RPC image without reprojecting the RPC image.
- 4
Click OK. The cursor changes to a crosshair symbol. 2. 5
Draw polylines along roadways in the image. After each one, right-click and select Accept. Alternatively, if you make a mistake, right-click and select Clear. 3. 6
Practice drawing and accepting polylines throughout the roadways in the image. Single clicks will place a vertex at the selected point, and holding left-click on your mouse will allow you to draw a polyline manually. Explore which methods work best for you. 4. 7
When complete, you can save layer changes byright-clicking in the Image window view and clicking Save. Save layer changes to a new file by right-clicking in the Image window and selecting Save As. You can also use Save As when saving a new vector layer for the first time. Save your vector layer as Roads.shp.

Saving the new layer creates a new attribute table, which consists of the numeric attribute RECORD_ID.
- 8
To hide a vector layer in a view, disable the check box for that layer in the Layer Manager. To show the layer, enable the check box. Or, right-click on the View icon in the Layer Manager and select Show All Layers and Hide All Layers to show/hide all layers at once. 2. 9
To rename a layer, right-click its name and select Rename Item. Enter the new name in the Rename Item dialog and press the Enter key to accept it or press the Esc key to cancel.
Linux and Mac users should click the green check icon to accept the new name or click the red X icon to cancel.
- 10
To remove a vector layer from the Layer Manager, right-click on the layer and select Remove. This removes the layer from the Layer Manager, but the file remains open and you can access it for redisplay from the Data Manager. 2. 11
For future reference, if you display multiple views, you can drag-and-drop vector layers from the Layer Manager to any one of those views in the display or to the corresponding view icons in the Layer Manager. This creates a copy of the layer(s) to populate the views; for example:

- 12
To add a vector layer to a new view, right-click on a filename in the Data Manager and select Open Selected Dataset in New View. 2. 13
Each time you open a new vector file, the layer appears at the top of the Layer Manager and becomes the selected layer. The purpose of a selected layer is to allow you to apply a display enhancement (transparency, etc.) to that layer only, without affecting other layers. To select a layer, click its name in the Layer Manager.
Adding Vectors
If you're working with shapefiles or ENVI Vector Files (EVF), you can add your own vectors to your work.
- 1
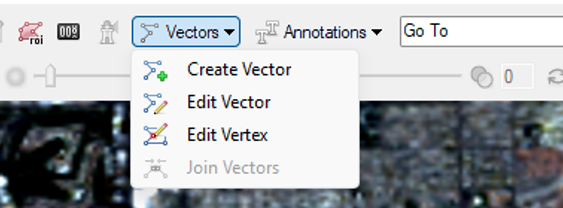
In the active layer, click the Vectors drop-down on the toolbar and select Create Vector, then click on the image where you want to add the vector.
- 2
Create polygons or polylines by clicking and dragging to draw them, or click at intervals to add vertices one at a time. 2. 3
Use the Right-click menu options to accept vectors when they are drawn. 3. 4
Multipoint vectors can be added only to a vector file that is designated a multipoint file. 4. 5
Group or ungroup vectors by selecting them and using the Right-click menu options.
Editing a vector layer with an associated attribute table does not change the existing attribute values. Depending on the type of edits you make, this may mean the values in that record are no longer valid.
Edit or Delete Vectors
You can edit or delete vectors in shapefiles and EVFs only. The options include: delete a record, move a polyline or polygon vertex, add or delete a polyline or polygon vertex, group or ungroup records. join polylines, merge or split polylines or polygons, smooth polygons, rectangulate polygons. and remove polygon holes.
- 1
Select Roads.shp click the Vectors drop-down on the toolbar and select Edit Vector. 2. 2
If you'd like to add more polylines to your shapefile, do so now. 3. 3
Click the Vectors drop-down on the toolbar and select Edit Vertex. 4. 4
With Roads.shp selected in the Layer Manager, click on a vertex of one of your polylines.

Notice in the above example that the vertices aren't perfectly lined up with road below. With Edit Vertex active, you can click a vertex within the polyline and manually adjust it to more accurately display the intended feature.

- 5
Right-click and select Accept Changes when satisfied with your edits.

Use the right-click menu to choose edit or delete options for the selected layer(s).
Change Vector Properties
Changing properties works for all supported vector types. The properties of a vector layer are displayed below the Toolbox.

You can edit the basic properties directly in this panel.
To edit the display properties for a given attribute, right-click on a vector layer in the Layer Manager and select Properties. In the Vector Properties dialog, select an attribute name from the Attribute drop-down list. The Attribute Values section on the left side of the Vector Properties dialog lists the unique values for that attribute.

- Use the top table to edit the display properties of a selected attribute.
- When you display a vector file for the first time, the Vector Properties dialog assigns a default fill color of red for all attributes.
- To change the fill color for all values for the selected attribute, select theSolid Coloroption from the Color Table drop-down list. Otherwise, select different color options as needed. For example, you could assign different colors to different road types such as dirt, multi-lane, etc. A preview of the currently selected color table is displayed below the drop-down list.
- To change the symbol for all values of the selected attribute, select the Point Styledrop-down list and then select the desired symbol.
- For polygon shapefiles, if the Fill Interior property is set to Trueand you select an option from the Color Table drop-down list (besides Solid Color), the Line Color property in the top table is automatically set to black. You can change this if needed. If theFill Interior property is set to False and you select a color table, the outlines of the polygons are colored according to the selected color table.
- If the Fill Interiorproperty is set to Truefor polygon shapefiles, the fill is temporary disabled if you use the Pan, Fly, or Rotate tools to move around the display.
- If the attribute has more than 256 unique values, the selected color table is equally divided among the number of attributes, creating a color gradient. Select the Cycleoption if you want the color table to repeat itself with each iteration of 256 unique values.
- Click Apply to commit your changes to the Image window.
Vector to Feature Count
Use the Vector to Feature Counttool to convert vector records into a feature counting layer. The centroids of each vector record will establish the feature counting locations.
- 1
In the Toolbox, expand the Vector folder and double-click the Vector to Feature Count tool.

The Convert Vector Records to Feature Count dialog appears.
- 2
Click the Browse button next to the Input Raster field, and select LasVegasMay2020.dat. This raster will determine the base projection for the output feature counting layer. 2. 3
Click the Browse button next to the Input Vector field. 3. 4
Go to the "natural_earth_vectors" directory in your ENVI installation path and select the airports.shp file.
Windows: C:\Program Files\NV5\ENVIxx\data\natural_earth_vectors (xx is the version number)
Linux: /user/local/NV5/envixx/data/natural_earth_vectors
Mac: /Applications/NV5/envixx/data/natural_earth_vectors
- 5
Click Open.

ENVI supports (.evf, .shp, .json, .geojson, and .gpkg) for Input Vectors.
Optional:
- In the Attribute Name of the Feature Column field, specify the attribute name of the column containing the feature class.
- In the Attribute Name of the Description Column field, specify the attribute name of the column containing the description.
- In the Attribute Name of the Acquisition Time Column field, specify the attribute name of the column containing the acquisition time.
Attribute Name of the Feature Column
In the Attribute Name of the Feature Column field, specify the attribute name of the column containing the feature class. This helps in identifying the specific features within your vector data. Ensure that the attribute name is unique and descriptive.
Using clear and consistent attribute names will make it easier to manage and edit your vector data. This practice is especially useful when working with large datasets.
Attribute Name of the Description Column
In the Attribute Name of the Description Column field, specify the attribute name of the column containing the description. This field is optional but can provide additional context to your vector data. Use descriptive names that clearly convey the purpose of the column.
Including descriptions can help others understand the data more easily. It also aids in data management and documentation.
Attribute Name of the Acquisition Time Column
In the Attribute Name of the Acquisition Time Column field, specify the attribute name of the column containing the acquisition time. This information is crucial for tracking when the data was collected. Ensure the attribute name is clear and follows a consistent naming convention.
Accurate acquisition time data is essential for time-sensitive projects. It helps in analyzing trends and changes over time.
- 4
In the Output Feature Count field, enter an output file name of airport_featurecount.efc. 2. 5
To reuse these task settings in future ENVI sessions, save them to a file. Click the down arrow and select Save Parameter Values, then specify the location and filename to save to. To apply the saved task settings, click the down arrow and select Restore Parameter Values, then select the file where you previously stored your settings.
Some parameter types, such as rasters, vectors, and ROIs, will not be saved with the file.
- 6
Click OK. 2. 7
When processing is complete, select File > Open from the ENVI main menu bar, route to where you saved your feature counting file, and select airport_featurecount.efc. 3. 8
When the Data Selection dialog prompts you to choose an associated raster for the feature counting file, select LasVegasMay2020.dat.
ENVI creates a feature counting layer and displays it over the input raster. It opens the Feature Counting Tool so that you can view the attributes of the feature counting layer.

This concludes the quick guide. For more information, see the Vectors(opens in a new tab) topic in the Documentation Center.
Your input is important to us, please take a few moments to fill out ourQuick Guide Feedback(opens in a new tab)form.
© 2025 NV5 Geospatial Solutions, Inc. This information is not subject to the controls of the International Traffic in Arms Regulations (ITAR) or the Export Administration Regulations (EAR).