Draw Regions of Interest
来源: https://vis-webcontent.s3.amazonaws.com/quickguides/Process+Raster+Data/Draw+ROIs/index.html#/
Lesson content
Lesson 1 of 1
Draw Regions of Interest (ROIs)
Use Regions of Interest (ROIs) to label individual or groups of pixels belonging to a user defined class. This quick guide is meant for you to get hands on experience with defining different types of ROIs. Here are some typical usages of ROIs.
- Classification: ROIs are commonly utilized in supervised classification to train algorithms using sample areas that represent various land cover types.
- Statistical Analysis: ROIs can be employed to gather statistics from particular image areas, such as the mean, standard deviation, and pixel count.
- Spectral Analysis: ROIs assist in creating spectral libraries by identifying areas with known materials to study their spectral signatures.
- Change Detection: Defining ROIs across different time-series images allows for the monitoring of changes in specific areas over time.
- Accuracy Assessment: ROIs are instrumental in validating the accuracy of classification results by comparing the classified pixels within the ROI against ground truth data.
Open an Image
- 1
From the Menu bar, select File > Open. An Open dialog appears. 2. 2
Go to the "data" directory in your ENVI installation path.
Windows:C:\Program Files\NV5\ENVIxx\data (xx is the version number) Linux:/user/local/NV5/envixx/data
Mac:/Applications/NV5/envixx/data
3. 3
Select the file qb_boulder_msi and click Open. The image is added to the Layer Manager and displayed in the Image window.
Create ROIs from Geometry
To create ROIs from geometry, draw shapes or mark points on the raster layer. Here is a breakdown of the different geometry features within the ROI Tool.

- •
Polygonor Polyline: Click to mark the vertices of the polygon or polyline, or click and drag to draw the shape. To complete the shape, press the Enterkey once, or right-click and select Complete (shape_type). Until you "accept" the shape, it appears translucent and you can edit its size or vertices, or move it. * •
Rectangle or Ellipse: Click and drag to draw the rectangle or ellipse. Until you "accept" the shape, it appears translucent and you can edit its size or vertices, move it, or rotate it. * •
Point: Click to mark points. Until you "accept" the points, they appear as crosshairs.
Polygon ROIs
- 1
Click the Region of Interest (ROI) Tool button in the Toolbar. The Region of Interest Tool window will appear.

- 2
In the ROI Tool, click the New ROI button in the toolbar. In the Layer Manager, the selected raster layer becomes the parent to the new ROI layer that is added below it.

- 3
Select the Geometry tab if it's not already selected. 2. 4
Click the Polygon button. 3. 5
Go to the large white building located at 400010N, 1051234W.

- 6
Trace the perimeter of the building by placing vertices by left-clicking on building corners. When complete, right-click and select Complete and Accept Polygon. The new ROI is added to the ROI layer, and the Record Count in the ROI Tool increments. Once accepted, a shape appears in solid color. 2. 7
Assign an ROI Name of Building and press the Enter key.

When adding any shape or point, you can press the Delete key to clear it, or right-click and select Clear (shape_type). For polygons or polylines, press the Backspacekey to delete the last vertex drawn.
Polyline ROIs
Use the polyline capture type to label long, linear features such as roads or rivers.
- 1
Click the New ROI button. 2. 2
Click the Polyline button within the geometry tab. 3. 3
Name this ROI Roads and then press the Enter key. Feel free to change the ROI color.

- 4
Find a straight road and then begin the capture by placing a vertex at the beginning and then again at the end. When finished, right-click and select "Complete and Accept Polyline". Repeat this process for several different roadways in the image. Add vertices when needed for curves in the road.

You can hold and trace while creating polylines. This will give you more freehand control of how your polyline will appear once completed. Use Backspace to clear your most recent vertices or Delete to remove the polyline altogether.
Create ROIs by Painting Pixels
Use the Pixel tab within the ROI Tool to paint pixels using a brush. For certain classes, this method can minimize the need to click.
- 1
Within the ROI Tool, click the New ROI button. 2. 2
Name the ROI Tennis Courts and pick an appropriate color. 3. 3
Select the Pixel tab.
![]()
- 4
Go to tennis courts located at 400017N, 1051325W. 2. 5
You can change the size of the brush in the Brush Size drop-down menu. Users can select from 1, 2, 3, 4, 5, 10, 25 pixels for brush size. 3. 6
Click a pixel within a tennis court, or click and drag your selected brush size on area of pixels.
Note: Brush Size 3 works well for this area.
![]()
FYI: To delete an individual pixel, place the selection box cursor over the pixel. Then right-click and select Delete Pixel, or press the Delete key. If you added pixels using a brush size larger than 1x1, you can also delete the pixel group as a whole, or only part of it.
To delete all pixels from an ROI, select the "Delete All Pixels" button from the ROI Tool indicated by four red x's next to Pixel Count.
- 7
(Optional) While in the Pixel tab of the ROI Tool, hold the Shift key. The cursor symbol changes to a minus sign. 2. 8
(Optional) Holding Shift and left-click, draw around the pixels you wish to delete. When satisfied, release the left mouse button. The selected pixels will be deleted.
![]()
Create ROIs Using the Magic Wand Tool
Manually drawing polygons around complex objects such as clouds, tree crowns, and lakes can be time-consuming and labor-intensive. In these cases, you can use the Magic Wand tool to grow complex polygons from one or more "seed" pixels. Let's use this tool to create ROIs of bodies of water.
- 1
In the ROI Tool, click the New ROI button on the toolbar. 2. 2
Rename the new ROI to Water and press the Enter key. 3. 3
Click the Geometrytab. 4. 4
Click the Polygon button. 5. 5
Hold down the Ctrlkey, then click on a pixel inside of a water body. The Magic Wand Parameters dialog appears. ENVI grows the region around the seed pixel by including neighboring pixels that are within the specified Threshold value. 6. 6
Use Ctrl-click to add more seed points within the same object to help it grow correctly. Or, add more seed points to similar objects to create a multi-part polygon. The Number of Seed Points is incremented. To remove the last seed point, click theRemove Seed Point button.

- 7
Adjust the Thresholdvalue to shrink or expand the current region. The range of values is 0 to 255, where 0 is the seed pixel and 255 is the entire image. The Magic Wand tool calculates thresholds based on the byte-stretched data that is displayed in the view. A Threshold value of 10 works well for this example. 2. 8
Right-click and select "Accept Multi Part".

If the size of the region exceeds the Tile Size (1000 pixels by default), and the Use Pyramids option is enabled, the Magic Wand tool will use a coarser pyramid level to grow the region. This allows large regions to be represented by a polygon but at a reduced pixel resolution; for example:
If you disable the Use Pyramids option, then the polygon will be at full pixel resolution but will only grow as large as the specified Tile Size.
Creating ROIs from Band Thresholds
To create ROIs from band thresholds, set specific image values or ranges of values. Let's create an ROI Threshold for vegetation in the area.
- 1
Choose one of the following:
- •
In the ROI Tool, click the New ROI button on the toolbar. In the Layer Manager, the selected raster becomes the parent to the new ROI layer that is added below it. In the ROI Tool, click the Threshold tab, followed by the Add New Threshold Rule button. * •
From the Toolbox, selectRegions of Interest > Band Threshold to ROI.
A new ROI is added to the Layer Manager, and the Data Selection dialog appears.
- 2
Select Band 4 to threshold and click OK. The Choose Threshold Parameters dialog appears, which includes a histogram of the band.
- 3
Use the Min Value and Max Value fields to define the ROI as follows:
- •
Enter only aMin Value to create an ROI using pixels that are greater than or equal to the value. * •
Enter only a Max Value to create an ROI using pixels that are less than or equal to the value. * •
Enter both minimum and maximum values to create an ROI using pixels that fall within the specified range.
- 4
Enter a Min Value of 180 and a Max Value of 300.

If you accessed the threshold tool from the Threshold tab, you can enable the Previewcheck box to see the selected pixels in the view.
- 5
Click OK to accept the threshold. If you accessed the band threshold tool from the Threshold tab, the ROI automatically loads in the Image window. If you accessed the tool from the Toolbox, open the Data Manager and load the ROI. ENVI lists the ROI in the ROI Tool by the name of the band used to extract the ROI. 2. 6
Name the ROI Vegetation and change the color to a shade of green.
Ideally, you would have used a band threshold of a spectral index to label vegetation.
Saving ROIs
Through the ROI Tool you can save your ROIs as .XML files for later use.
- 1
In the ROI Tool dialog window click File > Save As. The Save ROIs to .XML window will appear. 2. 2
Select all of the ROIs you created.
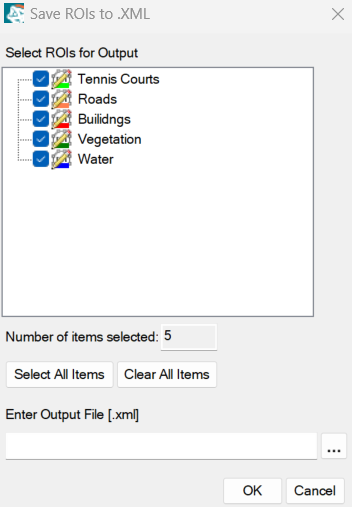
- 3
Enter an output file name and path. 2. 4
Click OK.
This concludes the quick guide. When you are finished, exit ENVI.
Your input is important to us, please take a few moments to fill out ourQuick Guide Feedback(opens in a new tab)form.
© 2024 NV5 Geospatial Solutions, Inc. This information is not subject to the controls of the International Traffic in Arms Regulations (ITAR) or the Export Administration Regulations (EAR).