Collect Classification Training Data from Image Spectra
Lesson content
Lesson 1 of 1
Collect Classification Training Data from Image Spectra
In this quick guide, you will:
- •
Set a zoom interpolation preference. * •
Open and display a Sentinel-2 layer-stacked image. * •
Create a Region of Interest (ROI) file with predefined land-cover classes. * •
Open and display a high-resolution reference image to help discern land-cover types. * •
Draw ROIs on image pixels that represent each land-cover type.
Sample Data
Download sample data below. Then extract the contents of the .zip file to a local directory.
[Sentinel2_LandCoverClassification.zip
1.7 GB
DownloadArrow down with horizontal line beneath it](assets/Sentinel2_LandCoverClassification.zip)
Background
A key component of supervised classification is the use of training data, which areexamples of the features you are interested in. These examples have a known identity because they were selected from the image with a high degree of certainty that they correspond to specific features. Classification algorithms use the spectral properties of the training data to classify pixels of unknown identity into one of the classes you defined.
In ENVI, you can draw ROIs on multispectral image pixels that you know belong to each class. For example, you may have a "vegetation" ROI that contains examples of vegetation pixels. See the Draw Regions of Interest quick guide for more information about ROIs.
Set the Zoom Interpolation Method Preference
To see individual pixels as you zoom in to collect training data, you will need to change the default zoom interpolation method to Nearest Neighbor. It is currently set to Optimized Bicubic, which shows a blurred effect as you zoom in.

- 1
Select File > Preferences from the Menu bar. The Preferences dialog appears. 2. 2
Select the Display General item on the left side. 3. 3
Click in the Zoom Interpolation Method field and click the small drop-down arrow that appears. 4. 4
Select Nearest Neighbor.

- 5
Click OK to dismiss the Preferences dialog. 2. 6
Close ENVI. 3. 7
Restart ENVI for the preference to take effect.
Open and Display a Sentinel-2 Multispectral Image
- 1
Select File > Open from the Menu bar. An Open dialog appears. 2. 2
Go to the directory where you saved the sample data, and select the file Sentinel2_LayerStack_Montana.dat. 3. 3
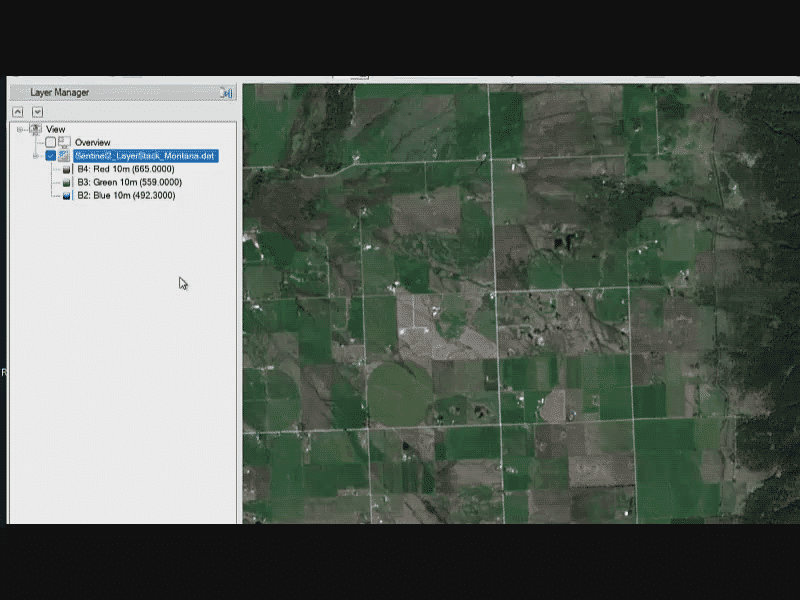
Click Open. The image is added to the Layer Manager and displayed in the Image window. 4. 4
Click the Zoom to Full Extent button in the Toolbar.


This is a layer-stacked image, which means that the 10-meter and 20-meter multispectral bands were combined in one image rather than in separate band groups. See the Build Band and Layer Stacks quick guide for more information.
- 4
Optional: Use the Brightness slider in the Toolbar to increase the image brightness. 2. 5
Select File > Data Manager from the Menu bar. The Data Manager lists all 10 bands of the layer-stacked image. They cover the visible to shortwave-infrared (SWIR) range of the electromagnetic spectrum. They were given custom names—such as "B4: Red (10m)"—by using the Edit ENVI Header tool to edit the image metadata. See the View and Edit Metadata quick guide for more information. 3. 6
Close the Data Manager.
Next, you will create a ROI file that will contain training samples for each output class.
Define Output Classes
A supervised classification requires you to define your output classes before you start. For this exercise, you will classify different land-cover types using the U.S. Geological Survey's LCMAP Level-1 scheme(opens in a new tab). The land-cover types include Developed, Cropland, Grass/Shrub, Tree Cover, Water, Wetland, Ice/Snow, and Barren.

Level 1 LCMAP land-cover classes. Source: U.S. Geological Survey, public domain.
- 1
In the Layer Manager, right-click on Sentinel2_LayerStack_Montana.dat and select New Region of Interest. The Region of Interest (ROI) Tool dialog appears. ENVI creates an empty, red class named "ROI #1."

- 2
In the ROI Tool, put your cursor at the end of "ROI #1" in the ROI Name field and click the Backspace key several times to delete the text. 2. 3
In the ROI Name field, type Developed and press the Enter key. The name changes to "Developed" in the Layer Manager and ROI Tool. You will keep the red color for this ROI. 3. 4
In the ROI Tool, click the New ROI button. A new, green "ROI #1" is created.

- 5
Change the ROI Name to Cropland and press the Enter key. 2. 6
Click the color drop-down arrow next to ROI Name. A color popup window appears. 3. 7
Choose a dark-orange color; for example:

- 8
Repeat Steps 4 through 7 to define the remaining classes:
| Class Name | Color |
|---|---|
| Grass/Shrub | Light green |
| Tree Cover | Dark green |
| Water | Blue |
| Wetland | Light blue |
| Ice/Snow | White |
| Barren | Gray |
When you are finished, the Layer Manager lists the ROIs as follows:

Here is a silent video clip of these steps:

Video Player is loading.
Play Video
Play
Loaded: 0%
0:00
Remaining Time --:-
1x
Playback Rate 1x
- 2x
- 1.75x
- 1.5x
- 1.25x
- 1x, selected
- 0.75x
- 0.5x
- 0.25x
Captions
- captions off, selected
Picture-in-PictureFullscreen
Mute
This is a modal window.
- 9
Select File > Save As from the ROI Tool menu bar. The Save ROIs to .XML dialog appears. 2. 10
Click the Select All Items button. 3. 11
Enter an output file name of TrainingDataROIs.xml.

- 12
Click OK to save the ROI file to disk. You will save it again later after you have collected training data for each ROI.
Open and Display a Reference Image
Later, you will collect samples of each land-cover type from the Sentinel-2 image and store them in their respective ROI. The red, green, and blue bands used to create a true-color composite have a spatial resolution of 10 meters. As you zoom in to collect training samples, you may find it difficult to positively identify different land-cover types.
To help guide you, we included a National Agriculture Imagery Program (NAIP) orthophoto mosaic of the same area as the Sentinel-2 image. The orthophoto has a much higher resolution (60 cm) than the Sentinel-2 image, and it was acquired one day before the Sentinel-2 image. You can use the orthophoto as a visual reference when collecting training samples from the Sentinel-2 image.
- 1
From the ENVI Menu bar, select File > Open. 2. 2
Select the file NAIP_Mosaic_Montana.dat and click Open. The image is added to the top of the Layer Manager and displayed in the Image window. 3. 3
Zoom into the image, then uncheck and check NAIP_Mosaic_Montana.dat in the Layer Manager to compare it to the Sentinel-2 image. You can see much more detail in the NAIP image; for example:

- 4
In the Layer Manager, right-click on Sentinel2_LayerStack_Montana.dat and select Order > Bring to Front. The Sentinel-2 image is moved to the top of the layer list.

Collect Training Data
When collecting training samples from an image, you should be highly selective and accurate when identifying pixels that represent the features you’re interested in. ROI records should not contain pixels from multiple features.
- 1
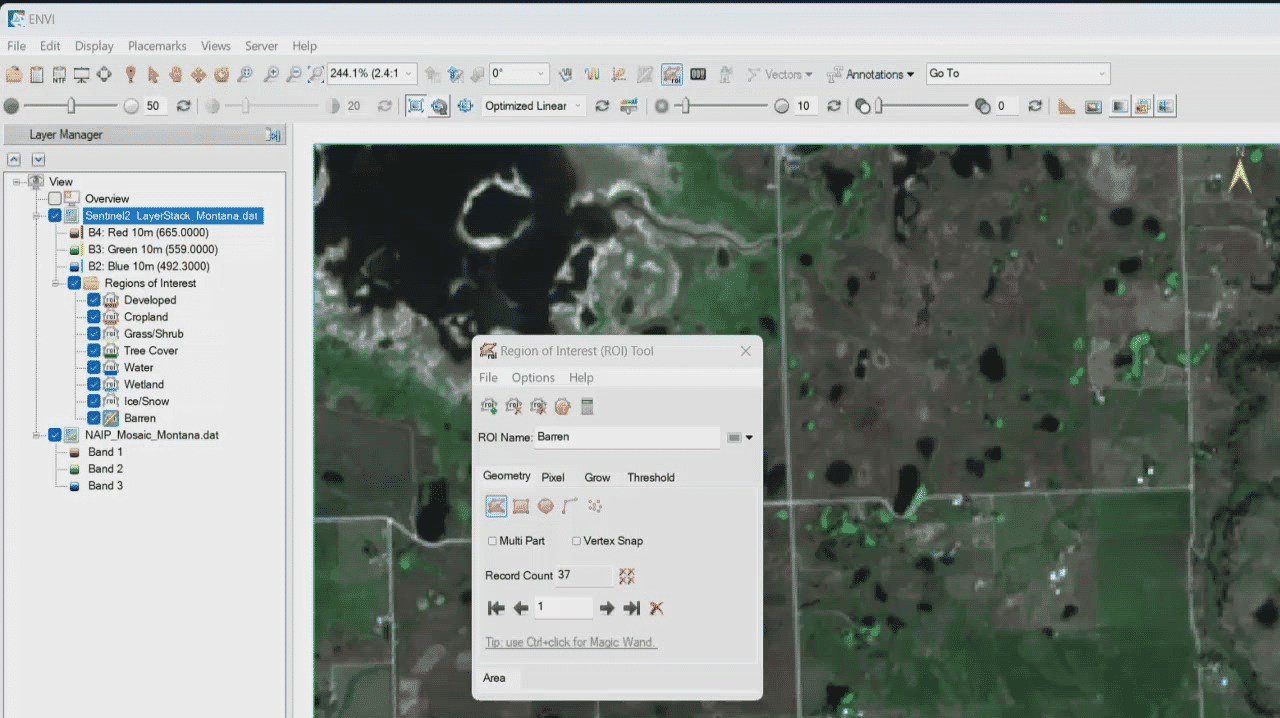
Start with the "Barren" class. In the Layer Manager, double-click the Barren ROI. The ROI Toolfocuses on this ROI, and the cursor changes to a crosshair symbol.
Different options are available to draw ROIs, but for this exercise, you will mostly use shapes such as polygons, rectangles, lines, and points. The ROI Tool is in Polygon mode by default. 2. 2
Look for an area that is mostly bare soil or rock with no vegetation.
Tip:Refer to the LCMAP table above for guidance on what to look for in each land-cover type.
If you are unsure what areas are barren, uncheck Sentinel2_LayerStack_Montana.dat in the Layer Manager to hide it. Or, select the Sentinel-2 layer and increase the Transparency value using the slider in the Toolbar.
- 3
Click in the Image window to start a polygon around some "barren" pixels. Click to define line segments of the polygon, or click and hold the left mouse button to draw a continuous line. To complete the polygon, either double-click near the start point, or right-click and select Complete and Accept Polygon. 2. 4
Draw more polygons around barren pixels. The Record Count section of the ROI Toollists the number of items you have drawn.
The following video clip demonstrates these steps.

Video Player is loading.
Play Video
Play
Loaded: 0%
0:00
Remaining Time --:-
1x
Playback Rate 1x
- 2x
- 1.75x
- 1.5x
- 1.25x
- 1x, selected
- 0.75x
- 0.5x
- 0.25x
Captions
- captions off, selected
- English
Picture-in-PictureFullscreen
Mute
This is a modal window.
Tips for Drawing ROIs
You should not draw ROIs on the NAIP image because its resolution is much different than that of the Sentinel-2 image. Instead, draw ROIs on pixels of the Sentinel-2 image that you are fairly certain belong to a given feature class. Only use the NAIP image as a visual reference.
To zoom in or out while you're drawing ROIs, rotate the scroll wheel on your mouse. To pan around, click and hold the middle mouse button, then drag in any direction.
To cancel drawing an ROI record, right-click and select Clear Polygon, Clear Polyline, or Clear Points, depending on what type of ROI you're drawing. With polygons, click the Backspace key to remove the last vertex and then redraw the polygon.
See the Draw Regions of Interest quick guide for more information about ROIs.
- 5
Double-click a different ROI name in the Layer Manager, then draw ROIs to collect training data for that feature. Aim for 10 to 60 polygon or polyline ROIs per feature class. The more high-quality ROI training samples you provide, the more accurate the supervised classification will be. 2. 6
Repeat this process for the remaining feature classes. This may take up to an hour to complete.
The following video clip demonstrates these steps.


Video Player is loading.
Play Video
Play
Loaded: 0%
0:00
Remaining Time --:-
1x
Playback Rate 1x
- 2x
- 1.75x
- 1.5x
- 1.25x
- 1x, selected
- 0.75x
- 0.5x
- 0.25x
Captions
- captions off, selected
- English
Picture-in-PictureFullscreen
Mute
This is a modal window.
When you are finished, the ROIs display over the Sentinel-2 image.

- 7
From the ROI Tool menu bar, select File > Save. 2. 8
This concludes the exercise.
Now that you have collected training data for each feature class, you can perform a supervised classification. See the Perform a Supervised Classification quick guide for more information.
Additional Resources
- •
ENVI Machine Learning Tutorial: Supervised Classification(opens in a new tab) (PDF) * •
Perform a Supervised Classification quick guide
Your input is important to us, please take a few moments to fill out ourQuick Guide Feedback(opens in a new tab)form.
© 2024 NV5 Geospatial Solutions, Inc. This information is not subject to the controls of the International Traffic in Arms Regulations (ITAR) or the Export Administration Regulations (EAR).