Introduction to ENVI Modeler
Lesson content
Lesson 1 of 1
Introduction to ENVI Modeler
Introduction
This quick guide provides a basic introduction to the ENVI Modeler. ENVI Modeler can be used to create custom task-based workflows in ENVI. It combines the power of the ENVI application programming interface (API) with a simple and intuitive user interface to help you build workflows without any programming knowledge.
In this quick guide you will learn how to open and navigate the ENVI Modeler interface, and display and run an existing model.
ENVI Modeler works on all platforms supported by ENVI(opens in a new tab). Model files can be shared with colleagues and used to run models in a desktop or enterprise environment.
You can use the ENVI Modeler with an ENVI runtime license; for full functionality, an ENVI+IDL license is recommended.
Open and Navigate the ENVI Modeler Interface
- 1
Open ENVI Modeler. From the ENVI Menu bar, select Display > ENVI Modeler.
You can also open ENVI Modeler in two alternative ways:
- •
From the ENVI Toolbox, expand the Task Processing folder and double-click ENVI Modeler. * •
Drag and drop an existing.model file into ENVI.
The Modeler user interface—shown in the figure below—contains a menu bar, toolbar, a window containing "Basic Nodes," a window containing the "Tasks," and a Layout Window where you will build and/or visualize the models:

Elements of an ENVI Model
A model is composed of two main elements: nodes and connectors.
Nodes are the basic building blocks, which allow you to set input files, input and output parameters, tasks and other operations. Task nodes are yellow, whereas Basic nodes have different colors for input nodes, output nodes, and operation nodes. Task nodes are colored red if ENVI does not recognize them, for instance, if there is a dependency on an ENVI module you do not have a license for. There are also Comment nodes, which allow you to include comments in your model. These can be especially useful if you are sharing your model and want others to understand its purpose or the expected inputs and outputs.
Connectors are grey lines that connect one node to another. Nodes that accept inputs via a connector have arrows on the left side, while nodes that create outputs have an arrow on the right side.
The following figure shows an example model with a pink "Input Parameters" Basic node that creates an output, connected to a yellow "Spectral Index" Task node that accepts inputs and creates outputs, which in turn connects to a green "View" Basic node that accepts an input.

Open and Explore an Example Model
ENVI provides examples of models to show how ENVI Modeler works.

- 1
Select File > Open Example, to expand the list of example models that ship with ENVI 2. 2
Click on Simple Model. This brings up the model shown below:

The Simple Model example contains a pink Input Raster node, connected to a yellow ISODATA Classification Task node, connected to a Classification Smoothing Task node, in turn connected to two green output nodes: View and Data Manager. This model also contains 4 grey Comment nodes, which describe the model, the purpose of the Input Parameter node, and provide tips on interacting with task nodes and connections between nodes.
In any of the nodes, the following is the Rename icon. You can use the Rename icon to rename any of the nodes in your model.

- 3
Click on the Rename icon on the pink Input Parameters node. This brings up the Rename panel. 2. 4
Rename the node to Input Raster.

- 5
Click the green checkmark to confirm the new node name.
The following is the Parameters icon. You can use the Parameters icon to view and change the parameter values that are set for a node:

- 6
Click on the Parameters icon on the Input Raster node. You will see that the only Input Parameter that appears is the Input Raster.
The parameters set in an Input Parameters node will depend on which other nodes it is connected to. 2. 7
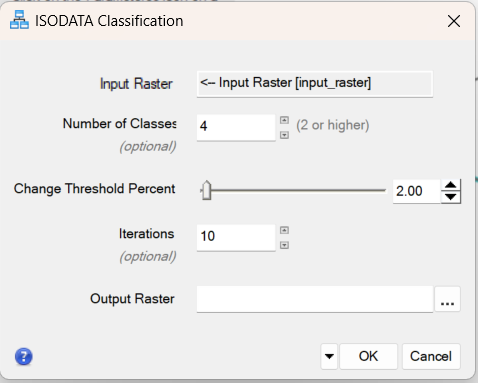
Click on the Parameters icon on the ISODATA Classification node.
You will see the values of the preset parameters for this ENVI Task. You will also see that the Input Raster is given directly by the Input Parameters node, which we renamed to Input Raster:
- 8
Click on the connection between the Input Raster and ISODATA Classification nodes. This brings up the Edit Connection Parameters dialog:

You will see that the only connection links the Input Raster from the Input Raster node to that for the ISODATA Classification, meaning that whatever raster you open when prompted by the Input Raster node will be the one the classification is performed on.
You can optionally create a new connection by clicking on Add New Input(s) on the left column and Output Raster URI on the right column, if you want to be prompted to enter a filename for the classification raster when you run the model.
Save, Validate and Run a Model
Once you have a complete model you can save, validate, and run it. Validation ensures the required input parameters have been set, that all parameter values are valid, and that all connections and output parameters are properly configured.
- 1
To save a model, select File > Save As, from the Modeler menu bar. Choose a name and location for the file and click Save. It will have a .modelextension. 2. 2
From the Modeler menu bar, select Code > Validate Model. This displays a Model Validation Report dialog that indicates any errors or warnings in the model. 3. 3
Click OK to dismiss the dialog. 4. 4
To run the model, click the Run button on the Modeler toolbar or select Code > Run Model from the Modeler menu bar. All nodes will turn grey first. Then the Input Parameters is highlighted in yellow. A dialog with your model name will appear, prompting you to select the Input Raster.
Note: if you have an ENVI+IDL license, you can select Code > Run Model in Debug Mode, which will generate an Execution Report dialog that contains execution times for each of the nodes and the entire model and reports the task parameter values that were used. 5. 5
Click on the ellipsis icon to the right of Input Raster. This brings up the Data Selection dialog. 6. 6
Click the Open File icon and navigate to the "data" directory in your ENVI installation path:
Windows: C:\Program Files\NV5\ENVIxx\data (xx is the version number)
Linux: /user/local/NV5/envixx/data
Mac: /Applications/NV5/envixx/data
7. 7
Click Open. Highlight qb_boulder_msi in the Data Selection dialog, then click OK. 8. 8
Click OK again on the original dialog to start the processing. The ISODATA Classification node turns yellow when that process is active, then green once the process finishes. The Classification Smoothing node then quickly flashes yellow followed by green. 9. 9
Minimize the ENVI Modeler window to show the ENVI Image window. The classification output from the model is displayed.

Other Useful Commands
- You can create new models by selecting File > Newfrom the Modeler menu bar or clicking the New button in the toolbar. This will create a new "Untitled" tab.
- To close a model or tab, select File > Close from the Modeler menu bar, or right click in the layout window and select Close Model.
- To close all open models, selectFile > Close All from the Modeler menu bar.
This concludes this quick guide.
Your input is important to us, please take a few moments to fill out ourQuick Guide Feedback(opens in a new tab)form.
© 2024 NV5 Geospatial Solutions, Inc. This information is not subject to the controls of the International Traffic in Arms Regulations (ITAR) or the Export Administration Regulations (EAR).