Creating a Simple ENVI Model
Lesson content
Lesson 1 of 1
Create a Simple ENVI Model
This quick guide walks you through how to build simple models in ENVI Modeler with different options for inputting data. You can find additional introductory information in the Introduction to ENVI Modeler quick guide.
You will learn how to build and run simple models for unsupervised classification of a multispectral image. You will create one model that uses a fixed raster as input, and a similar model that lets you specify your own input raster.
ENVI Modeler Input Options:
ENVI Modeler supports the use of the following node types for setting data inputs to a model:
- File - this node allows you to select one or more files saved on your computer.
- Dataset - this node allows you to specify one or more files that are already open in ENVI.
- Input Parameters node - this node allows you to set a variety of input parameters. Upon running the model, a dialog will display that prompts you to select the inputs, as well as set any other parameters for the tasks you connect this node to.
- Array of Values - this node allows you to specify an array of numbers or strings to be used as inputs for a task.
You can also set an input within a task node itself.
In this quick guide, we will create example models using the File and Input Parameter node options.
Example 1: Create a Model with a Predefined Input File
You will create a simple model to perform unsupervised classification on a multispectral image and view the output in ENVI.
Predefining files can be useful if you are running tests locally on your machine and want to avoid having to select the input file each time you run the process with new tweaks. Additionally, setting a hardcoded file in this manner is a requisite to generate a Python Program from your ENVI model. You can check out the Exporting ENVI Models quick guide for more details on exporting models.
- 1
Open ENVI Modeler: Display > ENVI Modeler. An Untitled tab appears with an empty layout window. 2. 2
Double click on File under Basic Nodes. A Select Type panel appears. 3. 3
Click on Raster. A Select Files dialog appears. 4. 4
Go to the "data" directory in your ENVI installation path.
Windows: C:\Program Files\NV5\ENVIxx\data (xx is the version number)
Linux: /user/local/NV5/envixx/data
Mac: /Applications/NV5/envixx/data
5. 5
Select the file qb_boulder_msiand click Open.
This is a QuickBird multispectral image of Boulder, Colorado. It has four bands: Band 1 (blue), Band 2 (green), Band 3 (red), and Band 4 (near-infrared).
A blue node namedqb_boulder_msi appears in the Layout Window, as shown below:

- 6
Under Tasks, type isodata in the search bar. Double-click ISODATA Classification. This adds a yellow ISODATA Classification Task node to the Layout Window.
When you select a task, you will see a brief description of the task below the Tasks list. You can click the Reset button to the right of the search box to remove the keyword you searched for and use the Filter by Tag button next to it to search tasks by categories. You can also right-click on any task and select Find Similar Tasks to populate the search results with other tasks with the same category labels. 2. 7
Double click on View under Basic Nodes. This adds a green node namedView.You can alternatively select the Data Manager node instead of the View node if you want your output to appear in the ENVI Data Manager in your current session instead of being displayed in the ENVI view. You can also have your classification node connect to both a View and Data Manager node to have both outcomes.
To adjust the position of the nodes, left click and hold on a node and drag it to a new position.
3. 8
Now you must connect the nodes. When you hover over a right or left arrow on a node, your mouse changes to a crosshair symbol. Hover over the right arrow on the qb_boulder_msi node until you see crosshairs, then left click and drag the dashed line that appears onto the left side arrow of theISODATA Classificationnode. If a connection is valid, the dashed line becomes solid, and you can release the click. You now have a solid connector line between the File and Task nodes. 4. 9
Connect the right arrow in the ISODATA Classification node to the left arrow in the View node.
You now have three nodes and two connectors for this simple model, as shown below. You can click on the Automatic Layout icon in the Modeler toolbar for the nodes to be laid out more neatly. The icon to its left, Center Model, will center your model within your Layout window.

The File node, qb_boulder_msi, has an icon on the bottom right that allows you to change the file you want to use as input, as shown below.
If you change the file path for your input file, want to run the model on a different computer, or want to choose a different file as input, you can use this icon to ensure you are pointing to the right file.

The ISODATA Classificationnode, like most Task nodes and some Basic nodes, has another icon on the bottom right, the Parameters icon, that allows you to change the parameters of that node:

- 10
Click on the Parameters icon in the ISODATA Classification node. This brings up the parameter window for this task, as shown in the figure above. You will see that the Input Raster parameter has been auto-filled with <- qb_boulder_msi. This indicates a connection with the File node. 2. 11
Leave the default parameters in the panel. You can choose a name and location for the Output Raster if you want to save it, or leave it blank to create a virtual raster. Click OKto dismiss the panel. 3. 12
Double click on the connector between the first and second nodes. This brings up the Edit Connection Parameters window and highlights the connection in cyan, as shown below. You will see a red line joining qb_boulder_msi on the left, to Input Raster on the right. This shows that the file you selected for the File node will be the input for the classification node.
Since this was the only possible connection between these nodes, the connection was made automatically. If more than one connection is possible between two nodes, the Connect Parameters dialog appears upon making the connection so that you can specify the correct connection manually. To make a connection, click on the item on the left column, followed by the item on the right column you want to match it to. Click on either connected item to remove a connection.

- 13
Click OK to close the dialog. 2. 14
Double click on the connector between the second and third nodes. This brings up the Edit Connection Parameters window. You will see a red line joining Output Raster on the left to Input Raster on the right. It shows that the only output from the classification task is a raster, and this raster will be the input for the ENVI view.
All the options beneath Input Raster in the View column are other file types this node could take as input if they were the outputs of your task of interest.

- 15
Click OK to close the dialog.
Save, Validate and Run the Model
Now that you have completed a model for unsupervised classification, you can save, validate, and run it.
- 1
To save the model, select File > Save or File > Save As, from the Modeler menu bar. Choose a name and location for the file and click Save. It will have a .modelextension. 2. 2
From the Modeler menu bar, select Code > Validate Model. This displays a Model Validation Report dialog that indicates any errors or warnings in the model. 3. 3
Click OK to dismiss the dialog. 4. 4
To run the model, click the Run button on the Modeler toolbar or select Code > Run Model from the Modeler menu bar. All the nodes are colored gray at first, then they turn to green to show that execution is complete. 5. 5
Minimize the ENVI Modeler window and to to the ENVI Image window. The classification output from the model is displayed, as shown below:

*Example 2: Create a Model with Input Parameters*
Instead of specifying a hard-coded file as input to the model using either the File or Dataset nodes, you can modify the model such that the user is prompted to select an input file once they run the model. You can use the Input Parameters node for this. An Input Parametersnode also allows the user to specify values for any of the parameters in the tasks while running the model, instead of needing to set them in advance.
Input Parameter nodes are useful when creating models that will be shared, as they do not rely on setting a fixed path for the dataset. As such, they allow the user flexibility to select whichever file they want to work on as they run the model.
- 1
Open the ENVI Modeler window with your simple model from above Display > ENVI Modeler. 2. 2
Save it as a new model using File > Save As. Choose a new name for this model, then click Save. 3. 3
Right click on the cyan File node, qb_boulder_msi, then select Delete 4. 4
In the Basic Nodes list, double click Input Parameters. This adds a pink Input Parameters node to the layout. 5. 5
Drag and drop this node to the left of the other nodes, where the File node was before. 6. 6
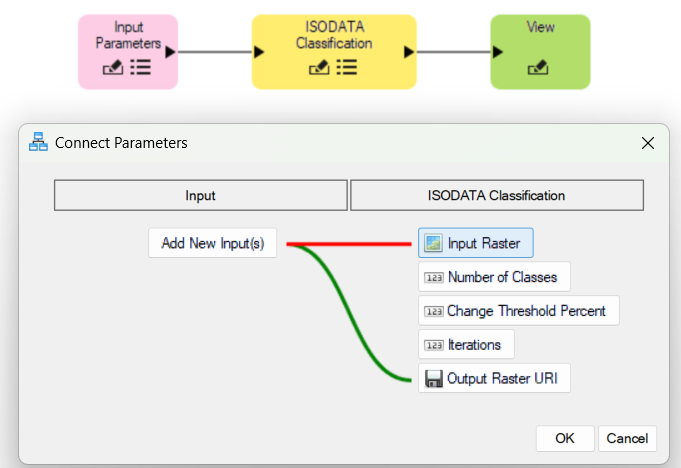
Draw a connector between theInput Parameters node and the ISODATA Classification node. This brings up the Connect Parameters dialog.
This dialog allows you to specify which of the classification node inputs you want to be set upon running the model, as opposed to within the task node itself. 7. 7
Click on Add New Input(s) on the left column, followed byInput Rasteron the right column. A red line joins the selections. 8. 8
ClickOutput Raster URI in the right column. A green line connects this item to the Add New Input(s) item in the left column.
If you want to set the values for any of the other parameters in the classification task, you can create similar connections to the Add New Input(s) item.
- 9
Click OK to dismiss the Connect Parameters dialog. 2. 10
Click the parameters icon on the ISODATA Classification node. Both the Input Raster and Output Raster fields will automatically be filled with the selected fields from the Input Parameters node, as shown below. You can adjust all the other parameters here.

- 11
Click OKto dismiss the dialog. 2. 12
Click the parameters icon on the Input Parameters node. You can edit the headers that will prompt you to select filenames for each of the added items.

- 13
Click OK to dismiss the dialog.
You can download this example model here:
[SimpleModel2.model
2 KB
DownloadArrow down with horizontal line beneath it](assets/SimpleModel2.model)
Run the Model with Input Parameters
Now that the new model is complete, you can run it. It is also a good idea to save your model before you run it, in case the program crashes and you lose any unsaved changes.
- 1
Save the model. 2. 2
Click Runon the toolbar, or select File > Runfrom the Modeler menu bar.
All nodes will turn grey first. Then the Input Parameters is highlighted in yellow. A dialog with your model name will appear, prompting you to select the Input Raster and specify an Output Raster URI. 3. 3
Click on the three-dot icon to the right of Input Raster. This brings up the Data Selection dialog. 4. 4
Click the Open File icon and navigate to the "data" directory in your ENVI installation path:
Windows: C:\Program Files\NV5\ENVIxx\data (xx is the version number)
Linux: /user/local/NV5/envixx/data
Mac: /Applications/NV5/envixx/data
5. 5
Click Open. Highlight qb_boulder_msi in the Data Selection dialog, then click OK. 6. 6
Click the three-dot icon to the right of Output Raster. The Data Selection dialog appears. 7. 7
Navigate to the directory where you want to save the output, specify a file name, then click Open.

- 8
ClickOK to proceed. The nodes will turn green as they run. Once complete, the output will display in the ENVI Image window, as with the previous run.
This concludes this quick guide.
Your input is important to us, please take a few moments to fill out ourQuick Guide Feedback(opens in a new tab)form.
© 2024 NV5 Geospatial Solutions, Inc. This information is not subject to the controls of the International Traffic in Arms Regulations (ITAR) or the Export Administration Regulations (EAR).